Technical companion
Detailed accounting, basin comparisons and audit records. Read the Water Findings brief for the main summary.
We can now quantify exports and useful long-term comparisons at two downstream gauges. Adding recorded storage changes and evaporation accounts changes those comparisons only slightly. They remain partial balances, not verified percentages of native runoff for the full valley or each colored basin.
23,370.94 AF/year
Approved tunnel export, WY2007-2024.
420,676.9294 AF / 18 years. [WATER:TECH-01]
13,148.95 AF/year
Five recorded collector intakes, WY2014-2024. These volumes overlap later tunnel exports and must not be added to them. [WATER:TECH-02]
About 52% at Gold Park
WY2007-2024; 35.6 mi2 drainage. Export comparison is 52.09% before corrections, 51.75% with storage and recorded evaporation accounts. Partial balance. [WATER:TECH-01, -03, -05]
About 43% at Red Cliff
WY2007-2011; 58.2 mi2 drainage. Corresponding comparisons are 43.04% and 43.08%. A different basin and period, not an uncertainty range for the full valley. [WATER:TECH-01, -03, -18]
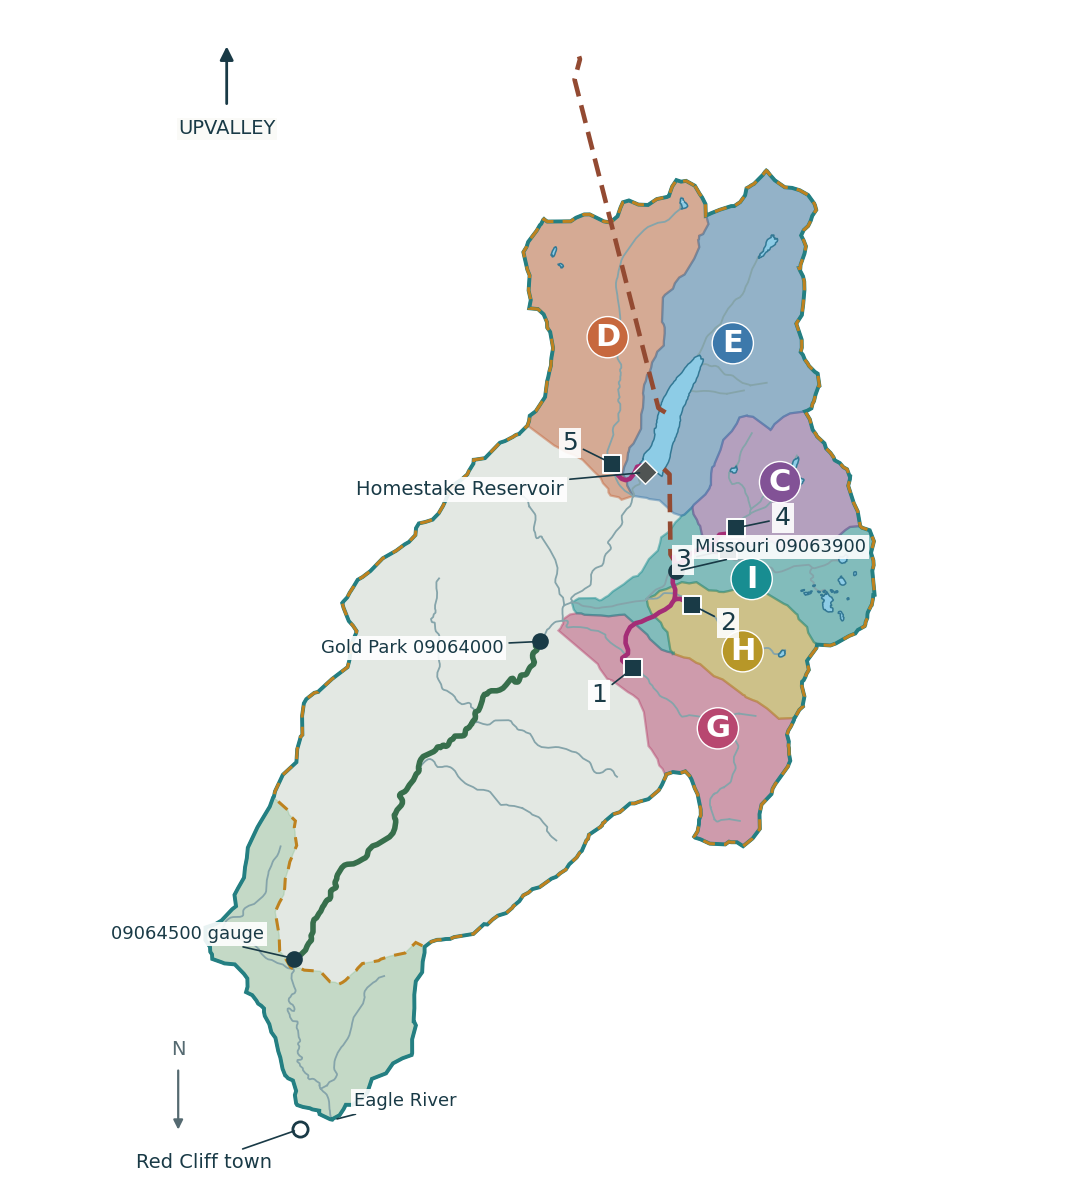
Map retains upvalley at the top. Colored areas end at stream junctions; intake catchments end at the intakes. Red Cliff town and gauge 09064500 are separate. French Creek joins above Gold Park. The new Missouri gauge is below Sopris and above Fancy. [WATER:TECH-05, -06]
Map basin / intake | 11-year capture (AF) | Mean AF/year | Native runoff share |
|---|---|---|---|
G French | 38,839.8627 | 3,530.90 | Not yet resolved |
H Fancy | 19,576.4190 | 1,779.67 | Not yet resolved |
I Missouri | 19,169.9901 | 1,742.73 | Not yet resolved |
C Sopris | 27,340.7254 | 2,485.52 | Not yet resolved |
D East Fork | 39,711.4677 | 3,610.13 | Not yet resolved |
E. Upper Homestake: the native-coded storage plus direct-flow ledger averages 13,306.09 AF/year in WY2014-2024. That is a source-coded accounting subtotal, not a verified E-basin capture total. Its unresolved physical reconciliation is on the Upper Homestake section.
How much do the remaining gaps matter?
Cumulative downstream balances: useful average comparisons, with the unmeasured corrections left visible.
At a gauge below all existing collection points, reservoir releases and collector transfers are internal movements already reflected in downstream flow. Do not add them again. Internal source-account disputes do not automatically invalidate the separately recorded tunnel export. Long-term storage changes telescope to ending minus beginning contents.
N = Q + E + change in storage + L - X + C
N: no-project runoff at the gauge; Q: observed creek; E: basin export. L: incremental project losses relative to the former landscape; X: external physical replacement inflow; C: other net depletions and measurement/routing corrections. L, X and C are not yet fully bounded.
Pooled term [WATER:TECH-01, -03, -05, -18] | Gold Park WY2007-24 | Red Cliff WY2007-11 |
|---|---|---|
Tunnel export E (AF) | 420,676.9294 | 139,942.6551 |
Observed creek Q (AF) | 386,968.0066 | 185,166.8700 |
Beginning storage, 30 Sep 2006 (AF) | 41,254.0313 | 41,254.0313 |
Ending storage, respective final Sep 30 (AF) | 42,265.5300 | 39,696.6900 |
Change in storage (AF) | 1,011.4987 | -1,557.3413 |
Recorded evaporation-use accounts (AF) | 4,321.7130 | 1,315.7251 |
Partial denominator N* (AF/year) | 45,165.4527 | 64,973.5818 |
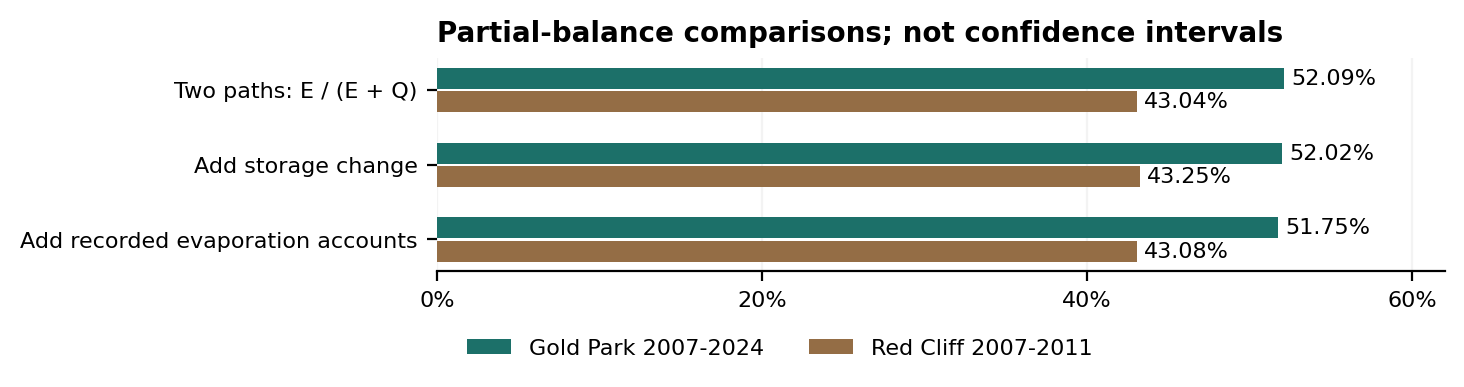
Worked Gold Park calculation: N* = (386,968.0066 + 420,676.9294 + 1,011.4987 + 4,321.7130) / 18 = 45,165.4527 AF/year. Export / N* = 23,370.9405 / 45,165.4527 = 51.7452%. N* includes accounting evaporation as a sensitivity input, not a verified native-flow denominator.
What is small: Gold Park storage carryover averages only +56.19 AF/year across these 18 years. What still matters: net project loss, physical external inflows, other depletions and gauge accuracy. Recorded evaporation is not yet verified as incremental loss; subtracting reservoir rain alone does not reconstruct the former landscape. No calibrated confidence interval is available.
Conditional net creek-flow reduction uses a different numerator, with all terms pooled: (E + storage change + recorded evaporation) / (Q + E + storage change + recorded evaporation) = 52.40% Gold Park and 43.00% Red Cliff. These are not bounds on export share. Full-mouth and individual intake-catchment percentages remain unresolved.
Coverage: Gold Park 6,575 Approved daily values, 2,876 estimated; Red Cliff 1,826, 1,311 estimated. Red Cliff Q uses preserved DWR-published USGS annual totals; current USGS daily integration is 19.8672 AF higher over five years, changing the screen by only 0.0026 percentage point. Sources and versions are retained separately.
E. Upper Homestake: the real balance
Worked water year: 1 October 2023 through 30 September 2024. Source precision is retained for reproducibility.
All five collection systems convey water into Homestake Reservoir. The tunnel draws from the reservoir. A “direct” tunnel account is an accounting category for pass-through water, not evidence of a separate pipe. The two outlet records must stay separate: the 2020 report does not instruct summation, and 2026 field notes place GH2 upstream of GH1. [WATER:TECH-04, -12]
Balance term [WATER:TECH-01, -02, -03, -04] | AF | Meaning |
|---|---|---|
Beginning storage, 30 Sep 2023 | 34,715.3750 | Approved contents |
Ending storage, 30 Sep 2024 | 42,265.5300 | Approved contents |
Change in storage | +7,550.1550 | Ending minus beginning |
Outlet record 1 | 2,976.9917 | HOMOUTCO DISCHRG; 366 daily values |
Outlet record 2 | 1,274.5190 | HOMOUTCO DISCHRG2; 366 daily values |
Validated total creek outlet | Unresolved | Do not add the two records |
Tunnel export | 18,151.9788 | Total class 13704614 only |
Five collector transfers into E | 12,163.9310 | Captured elsewhere within Homestake |
Recorded evaporation-use accounts | 278.3126 | 198.5406 stored + 79.7720 stream source |
A useful diagnostic, still short of native runoff
N* = verified outlet Q + export + change in storage + recorded evaporation - collector imports
= Q + 18,151.9788 + 7,550.1550 + 278.3126 - 12,163.9310
= Q + 13,816.5154 AF before unresolved physical corrections.
To estimate native stream inflow, also subtract precipitation directly on the reservoir and any physical external replacement inflow, add net seepage losses, and resolve other inflows and measurement corrections. Add the short downstream increment separately to reach mapped basin E. The evaporation account may already be net of some terms; its basis must be verified before adjusting it.
Separate audit checks | WY2024 AF | What remains unresolved |
|---|---|---|
Storage-account residual | +2,578.0447 | 25,114.7293 storage-use inflow - 14,787.9890 release accounts - 198.5406 stored evaporation - 7,550.1550 change in storage. |
Collector source-account residual | -1,367.0698 | Intake totals minus corresponding tunnel and reservoir source accounts. French and Sopris reservoir entries duplicate all 12 months. |
Using channel 1 alone gives an unaccepted diagnostic of 16,793.5071 AF. The earlier 18,068.0261 AF result added both records and is withdrawn as an accepted outlet balance. Neither is verified E runoff. Changing the feeder-account basis also shifts the result by 1,367.0698 AF. No calibrated confidence interval or percentage is defensible yet.
Specific records still needed: source ledger and corrections; inlet/bypass/spill/seepage topology and historical ratings/shifts; evaporation/precipitation basis; surface area and reservoir-native boundary. These E-basin gaps do not prevent the partial cumulative downstream calculations on the cumulative-balance section.
Native runoff: every basin has a status
“Unknown” below means not yet reconstructed from adequate matched records, not zero and not proof that records do not exist.
Area / reach | Mean AF/year | Balance status | Exact remaining limitation |
|---|---|---|---|
A Full Homestake to Eagle | 23,370.94 export* | Unresolved | No complete contemporary mouth flow/balance located. |
B Red Cliff gauge basin | 27,988.53 export | Partial only | WY2007-2011 comparison about 43%; not current full valley. |
Gold Park gauge basin | 23,370.94 export* | Partial only | WY2007-2024 comparison about 52%; smaller parent basin. |
G French | 3,530.90 capture | Unresolved | Need same-date native/bypass hydrograph and intake boundary. |
H Fancy | 1,779.67 capture | Unresolved | Stage telemetry located; verified cfs rating still needed. |
I Missouri remainder | 1,742.73 capture | Unresolved | Gauge combines Missouri + Sopris, excludes Fancy. |
C Sopris / Brady-Sopris | 2,485.52 capture | Unresolved | Combined gauge cannot separate the Sopris contribution. |
D East Fork / Lonesome-Isolation | 3,610.13 capture | Unresolved | Need collector inflow and bypass rating/records. |
E Upper / native reservoir branch | 13,306.09 coded** | Unresolved | Storage and two outlets recovered; balance still incomplete. |
F1 Gold Park to Red Cliff | No local total assigned | Unresolved | Gauge difference is net reach gain, not tributary native runoff. |
F2 Below Red Cliff gauge | No local total assigned | Unresolved | Need downstream flow and local inflow/depletion balance. |
* WY2007-2024. Red Cliff uses WY2007-2011; collector/coded means use WY2014-2024. Parent areas overlap: do not sum rows. **E is a ledger subtotal, not verified capture. Missouri gauge excludes Fancy. Gray drainage is not one uniform lower-valley basin. Basin A extends below Red Cliff to the Eagle River.
What the official natural-flow model adds
The official 2024 StateMod release still ends its natural-flow inputs in WY2013. It groups Homestake into reservoir + East Fork and a combined French/Fancy/Missouri/Sopris system. It has no separately validated native series for every map polygon. Its Gold Park natural-flow input totals 264,026 AF in WY2007-2011 and 325,557 AF in WY2007-2013. These historical model values and full monthly inputs are supplied separately. [WATER:TECH-07]
For the same WY2007-2011 window, our Gold Park partial balance totals 262,918.84 AF, 0.42% below the model. This is a consistency check with shared inputs, not independent validation or proof of individual-basin shares.
Two paths at the measured gauges

Ratios use matched recorded diversion/export and observed creek flow. They are not precipitation, snow or natural-flow fractions. Gold Park (35.6 mi2) cannot replace the Red Cliff basin (58.2 mi2). [WATER:TECH-01, -02, -05, -06]
New Missouri/Sopris measurements
USGS 09063900: 6.38-square-mile gauge drainage. Below Sopris; above Fancy. Intake accounting paired only to those sources.
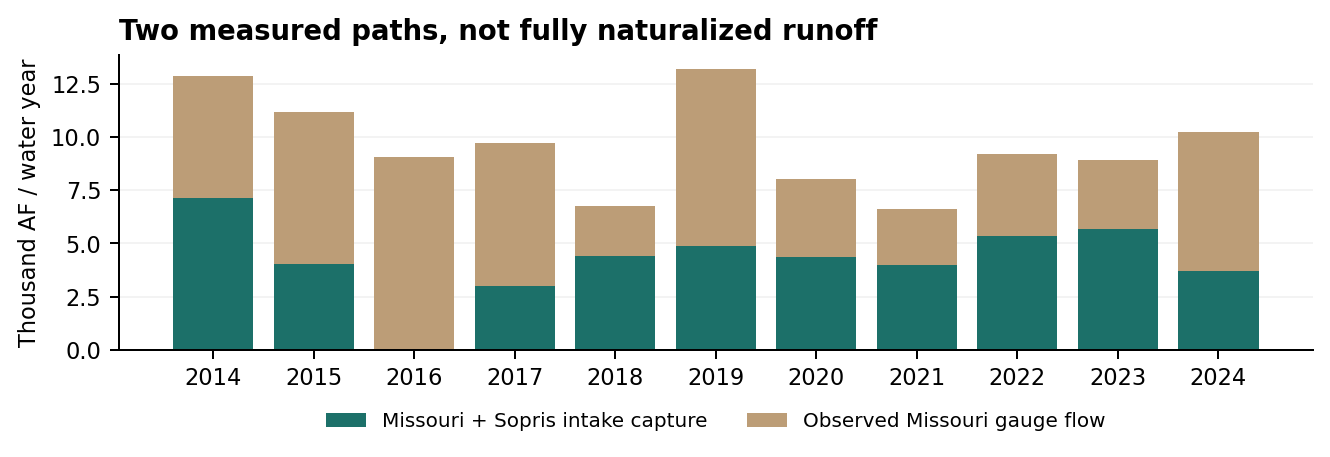
Volume-weighted WY2014-2024: 46,510.7155 AF captured / (46,510.7155 + 59,227.6165 AF observed creek) = 43.9866%. Observed creek branch = 56.0134%. This is a two-path screen. All 4,018 dates have Approved values; many are estimated daily discharges, retained as such. [WATER:TECH-02, -05]
WY | Capture AF | Creek AF | Creek mean cfs | Two-path % | Estimated days |
|---|---|---|---|---|---|
2014 | 7,125.31 | 5,737.39 | 7.925 | 55.40% | 205 |
2015 | 4,028.63 | 7,159.12 | 9.889 | 36.01% | 141 |
2016 | 0.00 | 9,074.86 | 12.501 | 0.00% | 213 |
2017 | 3,012.60 | 6,711.57 | 9.271 | 30.98% | 126 |
2018 | 4,416.40 | 2,318.74 | 3.203 | 65.57% | 192 |
2019 | 4,892.76 | 8,306.96 | 11.474 | 37.07% | 178 |
2020 | 4,337.28 | 3,703.99 | 5.102 | 53.94% | 192 |
2021 | 3,983.23 | 2,615.21 | 3.612 | 60.37% | 175 |
2022 | 5,342.10 | 3,837.62 | 5.301 | 58.19% | 197 |
2023 | 5,661.42 | 3,247.58 | 4.486 | 63.55% | 190 |
2024 | 3,710.99 | 6,514.59 | 8.974 | 36.29% | 173 |
WY2024 example: (1,402.6896 Missouri + 2,308.3006 Sopris) / (3,710.9902 + 6,514.5917 creek) x 100 = 36.2912%. Across years use the ratio of summed volumes, not the average of annual percentages.
Dry versus wetter season: May-July 2018 had 8.795 cfs mean observed creek flow and a 73.12% two-path capture screen. May-July 2019 had 35.176 cfs and a 43.15% screen. In August-September 2018, capture was recorded as zero while the creek averaged 1.096 cfs, with a 0.403 cfs minimum 7-day mean. Low flow alone does not establish diversion-caused damage.
Sensitivity: omit unresolved zero-capture WY2016 and the pooled screen becomes 48.1161%. An illustrative +/-10% change to creek Q gives 41.6535-46.5967%; this is not a statistical confidence interval. Five-collector capture is concentrated in spring: 88.2613% in May-June, 99.2952% in May-July. [WATER:TECH-02, -05]
Missing cfs: rights and creek flow differ
Legal diversion rates, bypass obligations and measured discharge each answer a different question.
Existing intake | Absolute right cfs | Conditional right cfs | Listed bypass cfs |
|---|---|---|---|
French Creek | 62.18 | 117.82 | 1.67 |
Fancy Creek | 38.60 | 91.40 | 1.00 |
Missouri Creek | 39.80 | 80.20 | 3.00 |
Sopris Creek | 41.30 | 118.70 | 2.00 |
East Fork Homestake Creek | 74.63 | 185.37 | 2.67 |
Current DWR net-amount records and 2025 city exhibits agree. French 60.10 + 2.08 = 62.18 cfs; East Fork 70.80 + 3.83 = 74.63 cfs. Older tables carry stale amounts. Bypass list also includes Middle Fork 6, Gold Park 24 and Fall 3 cfs. These are specified amounts, not evidence of actual continuous discharge. Full seasonal and low-natural-flow rules remain to be verified from governing decrees/permits. [WATER:TECH-08]
Whitney-related conditional rates now identified
Source | 1952 source right, cfs | 1995 new right / scope, cfs |
|---|---|---|
Homestake proposed intake | Alternate point, no standalone old rate | 400 |
Fall Creek | 260 | 250 combined old/new cap at new intake |
Peterson Creek | 50 | 70 combined old/new cap at new intake |
Whitney Creek | 80 | No separate 1995 source row identified |
Eagle River proposed intake | Alternate point, no standalone old rate | 300 |
These rates describe a rights inventory, not selected collection works or annual yield. Do not add Fall 260 + 250 or Peterson 50 + 70. Eagle-Cross has a 300 cfs new-right aggregate and a described 400 cfs system conveyance ceiling inclusive of changed older rights. Resolution Reservoir’s 5,000 AF right is storage, not cfs. [WATER:TECH-08]
The next-step records search has advanced, not closed
The March 2022 official factsheet remains the current linked version: Whitney storage alternatives are 6,850-20,000 AF; up to 20,000 AF/year is the broader Eagle River Joint Use objective. No selected Whitney-only dependable-yield simulation was recovered. A February 24, 2026 signed City resolution and related Otero/Wild Horse agreements document a conveyance connection; they do not establish an added Homestake annual yield. [WATER:TECH-09, -10]
Dated selected-design GIS, the governing rights-to-intake matrix, and a daily with/without-project model still have not been obtained. Older official court records identify specific engineering and yield studies; the follow-up search and records-request attachment names them. A record not found online is not evidence that no record exists.
Whitney-only additional export remains unknown. Hypothetical 0 / 2,500 / 5,000 / 10,000 / 20,000 AF/year increments are sensitivity inputs, not yield predictions. At each intake and day: capture must be no greater than physically available flow after applicable bypass, prior rights, pump/conduit limits and storage constraints. No scenario can yet be certified against all those terms.
What the wider internet search found
Additional public measurements and technical records beyond the supplied database. Search cutoff: 23 September 2026.
New source [WATER:TECH-12, -13, -14, -15] | Measurement / coverage | What it can and cannot establish |
|---|---|---|
USBR daily reservoir storage | 2014-09-30: 19,591.00 AF; 2016-09-30: 42,305.68 AF; 2021-09-30: 29,244.17 AF | Fills several DWR date gaps as a separate provisional source. A 374,386.998 AF outlier and other gaps must be excluded from inference. |
DWR outlet field measurements | 2024-07-03: 6.23 cfs; 2024-09-23: 1.45 cfs; 2026-08-27 tracer: 5.72 cfs | Nineteen records plus current GH1/GH2 and storage rating tables recovered. Historic shifts and channel topology remain to verify. No annual error bound follows from one spot test. |
River Watch near the mouth | 2016-04-06, 11:45 MST: 4.01 cfs | Validated spot flow at 39.505883, -106.378159. This fills a specific post-2011 observation, not the missing annual outlet series. |
EPA East Fork surveys | Two downstream visits in 2018 and an upstream visit in 2019 | Wetted width/depth, habitat and riparian measurements found. No discharge field in the recovered metrics. Different dates prevent a direct impact comparison. |
NOAA collector telemetry | Fancy FACC2, Sopris SOCC2, Missouri MOCC2, East Fork EFCC2 | Stage records confirm monitoring. Need station-specific ratings and whether each sensor measures diverted, bypassed or total creek flow. |
USBR tunnel calibration study | July 2014 PAP-1088, 42 field measurements from 1999 onward | Documents waves but a relatively stable empirical rating. No automatic 6% correction to historic exports is warranted. |
Two findings that change the interpretation
Do not add outlet records: DWR’s 2020 release analysis uses 174 cfs while DISCHRG2 separately records about 20 cfs. A 2026 field note identifies GH2 upstream of GH1. The earlier combined-outlet assertion is withdrawn. Channel-specific measurements and the configuration/rating history now provide concrete evidence to resolve the issue. [WATER:TECH-04, -12]
Lower peaks do not mean every low-flow metric declined: the 2005 Eagle River Inventory reports Gold Park’s average annual 1-day maximum declining from 640 to 230 cfs between its 1947-1953 and 1972-2001 periods, while its 7-day minimum increases from 3.4 to 4.8 cfs. These are historical observed-period comparisons with different climate windows, not modern causal estimates. They support examining season and operating rules rather than claiming all flows worsened. [WATER:TECH-16, printed pp. 91-92]
Named model records exist: official documents identify the January 2012 and January 2013 Water Yield Estimates for Homestake Project Expansion Options, CSU’s TM #11 - IWRP Modeling Systems, and Aurora’s referenced Gibbens Data 040704.xls. Their underlying intake-native series and current Whitney scenario files were not recovered. These exact titles replace a generic request for “more data.”
Current Wild Horse correction: Aurora announced a shift to Wild Horse South on 13 February 2026. Its February Q&A says existing rights and Otero would supply it without additional diversions. That sponsor premise needs testing against daily source operations; storage capacity alone cannot prove additional Homestake exports. The newly recovered 2023 BLM investigation maps concern the earlier site. [WATER:TECH-17]
Audit findings and the next useful records
Hydrologic effect, legal compliance and ecological damage attribution remain separate determinations.
Issue | Evidence | What it means / next record |
|---|---|---|
Upper storage ledger | +2,578.0447 AF residual in WY2024 | Obtain operator ledger, bookovers and corrected source derivations. |
Collector routing | -1,367.0698 AF; duplicate French/Sopris reservoir entries | Obtain raw meters and source-account revision history. |
WY2016 intake zeros | Four collectors zero for all 12 months | Verify whether true nonoperation or reporting gap; retain sensitivity. |
2020 outlet test | 153.9 cfs spot vs 173.4 cfs gauge | 19.5 cfs difference. Get both flumes’ rating/shift histories; no universal correction. |
2021 pilot refill | City report says reservoir did not refill | Report pp. 4-5 contradict assumed immediate refill; later years are separate. |
2021 tunnel discrepancy | City report 27,742 vs DWR 27,864.6443 AF | 122.6443 AF difference; reconcile periods and source-account revisions. |
Historic export conflicts | 1967-2025 station sum is unreconciled | Keep 1,428,171.11 AF separate from Approved matched-period sum. |
Archive availability | 225 intact atlas files recovered; tail damaged | September 20 full archive is listed, but download failed with HTTP 502; not inspected. |
The original database passes integrity and foreign-key checks. All 33 packet files, 27 hashed database sources and 17 collector responses match their preserved hashes. Approved status and exact arithmetic do not eliminate meter error or source-account ambiguity. Discrepancies are audit questions, not proof of unlawful diversion.
Prioritized next step
1. Bound the cumulative average. Prioritize a post-2011 Red Cliff or full-mouth flow series, independent gauge checks, incremental reservoir loss estimates, other net depletions and actual external replacement volumes/locations. These determine how far the useful cumulative-balance comparisons may shift; do not wait for every internal ledger to be perfect.
2. Resolve individual catchments. Obtain collector inflow/bypass series and effective ratings, the dated GH1/GH2 topology, corrected source ledgers and reservoir area/loss definitions. Start with WY2024. Retrieve the July 12, 2022 transit-loss study, revised September 27, including raw data and appendices. Stage is not cfs without a validated rating.
3. Obtain the actual Whitney scenario. Request selected or latest alternatives GIS, dated design revision, pump/conduit layouts, rights-to-intake mapping, and executable daily paired baseline/project model with input hydrology and validation. Include Wild Horse coupling and release/refill rules.
4. Tie hydrology to habitat. After flows are reconstructed, compare daily low-flow duration, snowmelt peaks and affected reaches. Add paired groundwater/fen level, temperature and habitat surveys before attributing ecological damage. A release below an intake cannot restore its upstream reach.
The separate Public-Records-Retrieval-Prompt lists exact public links and lawful alternatives for parser-size limits and failed downloads. Identified 2022-2023 board packets remain uninspected; they are leads, not confirmed study locations. Draft records requests are supplied but have not been sent.
Sources, definitions and replication
Primary records retrieved 23 September 2026 unless the original snapshot states otherwise. Exact UTC timestamps and SHA256 hashes travel with the data.
[WATER:TECH-01] DWR exports Approved monthly class 13704614, WDID 3704614. Original SQLite and source packet. Primary source.
[WATER:TECH-02] DWR collector accounts WDIDs 3701253 / 3701254 / 3701255 / 3701256 / 3704644; total classes only. Primary source.
[WATER:TECH-03] DWR reservoir and telemetry WDID 3704516 stagevolume and monthly records; HOMOUTCO DISCHRG and DISCHRG2. Primary source.
[WATER:TECH-04] DWR pilot release report 1 April 2021. PDF p. 20 calibration; Appendix A pp. 46-47 physical routing/two flumes. Primary source.
[WATER:TECH-05] USGS daily discharge 09063900 Missouri, 09064000 Gold Park, 09064500 Red Cliff. Qualifiers preserved. Primary source.
[WATER:TECH-06] USGS Gold Park station description 2003 annual record: gauge downstream from French. Current gauge area is 35.6 mi2; historic page says 36.0. NLDI/NHD polygons are modeled junction catchments. Primary source.
[WATER:TECH-07] Official StateMod inputs Upper Colorado cm2015 and Shoshone 2024 update, downloaded and independently parsed. Natural-flow record ends 2013. Primary source.
[WATER:TECH-08] Rights and bypass sources Live DWR netamount; June 2024 Division 5 resume, pp. 21-26; September 2023 resume, pp. 23-24; 2025 city exhibits. All direct URLs in rights source index. Primary source.
[WATER:TECH-09] CSU ERJU factsheet March 2022, 2 pages; current linked PDF re-fetched on research date. Primary source.
[WATER:TECH-10] City File 26-058 Adopted 24 February 2026; signed Resolution 11-26 and related Otero/Wild Horse IGA documents. Primary source.
[WATER:TECH-11] Cities’ final pilot verification 2 December 2021, PDF pp. 4-5 actual operations and non-refill finding. Primary source.
[WATER:TECH-12] DWR outlet field measurements HOMOUTCO, 19 entries through September 2026; raw values, remarks and qualifiers preserved. Primary source.
[WATER:TECH-13] USBR storage and operations Site 100120 daily storage and WY2024 operations report. Provisional series and endpoint comparisons in raw companion. Primary source.
[WATER:TECH-14] River Watch and EPA Water Quality Portal CORIVWCH_WQX-744; EPA NRSA UIDs 2012967/2013227/2014612. Query URLs and downloaded rows in source manifest. Primary source.
[WATER:TECH-15] USBR PAP-1088 July 2014, printed pp. 1, 3-4; PDF pp. 7, 9-10. Tunnel flume calibration, distinct from dam-outlet records. Primary source.
[WATER:TECH-16] Eagle River Inventory 2005 CSU-authored assessment, author-hosted copy; printed pp. 84-94 historical hydrology. Primary source.
[WATER:TECH-17] Aurora Wild Horse update 13 February 2026 South-site announcement and February 2026 presentation Q&A. Primary source.
[WATER:TECH-18] Red Cliff preserved annual flow DWR-published USGS totals, retrieved 20 September 2026; original source redcliff-year and hash in database. Primary source.
Arithmetic and reproducible files
Water year: October-September. DWR irrigation year: November-October. Capture is intake collection; export crosses the watershed divide; delivery is a later recipient/account quantity; consumption is depletion, not ownership. “Left” must name a reach and date. Natural flow is the no-project counterfactual at that same location and time.
SELECT water_year, ROUND(SUM(volume_af),4) AS export_af
FROM diversion_month
WHERE water_class_num=13704614 AND water_year BETWEEN 2007 AND 2024
GROUP BY water_year
HAVING COUNT(DISTINCT month)=12
AND MIN(approval_status)='Approved' AND MAX(approval_status)='Approved';
AF = sum(daily mean cfs) x 86,400 / 43,560. In the raw evidence ZIP, run restore_duplicates.py, then analysis_update/report/replicate.py --extended --report. The followup_criticality_2026-09-23/basins/calculate.py script reproduces the cumulative-balance section. Daily CSVs, raw sources, timestamps, hashes and caveats are preserved. The 41-sheet workbook has live key formulas; the separate Public-Records-Retrieval-Prompt gives lawful download alternatives.